Introduction:
Investors and traders worldwide seek strategies to predict market behavior accurately, aiming to make informed decisions that maximize returns while minimizing risk. In the vast array of investment tools and strategies, one concept has emerged as a beacon in the tumultuous sea of financial trading: Technical Analysis.
In a world where economic fluctuations can set off global shockwaves, navigating the financial markets may often feel akin to maneuvering a ship through an unpredictable storm.
Technical Analysis, a methodology often opposed with Fundamental Analysis, rests on the foundation that market prices inherently reflect all relevant information. Therefore, careful analysis of price patterns and trends, captured in charts and mathematical indicators, can reveal possible future price movements.
In other words, it is the art and science of recognizing and understanding the market’s language, a form of financial cryptography.
However, Technical Analysis is not a magical crystal ball that prophesies the exact future of market prices. Instead, it is a disciplined approach that helps investors make educated guesses about probable future price movements based on past market data. It equips market participants with a compass to chart their course through the choppy waters of financial markets.
This article delves into the fascinating world of Technical Analysis, exploring its underlying principles, its strengths and limitations, and how it can be effectively utilized in various trading scenarios.
Whether you are a seasoned investor or a beginner setting foot into the exciting realm of financial markets, this comprehensive guide aims to enrich your understanding of Technical Analysis, offering invaluable insights into using this powerful tool to steer your investment decisions confidently.
As we embark on this exploratory journey, let us demystify the intricate tapestry of price patterns, trend lines, and technical indicators, breaking down complex concepts into easily digestible pieces. Let us navigate together through the labyrinth of the financial markets, guided by the illuminating light of Technical Analysis. Welcome aboard!
OPEN A TASTYTRADE ACCOUNT AND PUT YOUR KNOWLEDGE INTO PRACTICE TODAY!

History of technical analysis
The roots of technical analysis trace back several centuries, starting with the concept of trends and chart patterns, and evolving over time with advancements in technology and statistical methodologies. Here’s an overview of the history of technical analysis:
17th Century – The Dawn of Market Analysis
The earliest known attempt at technical analysis dates back to the 17th century with the Dutch merchant Joseph de la Vega. His work, “Confusion of Confusions,” discusses the behaviors of traders and identifies recognizable patterns in their trading activities.
18th Century – Candlestick Charting
One of the earliest and most recognized forms of technical analysis, candlestick charting, was developed during the 18th century by a Japanese rice trader named Homma Munehisa. His work in tracking daily changes in the prices of rice futures forms the basis of candlestick charting.
Late 19th – Early 20th Century – The Foundations
Charles H. Dow, co-founder of Dow Jones & Company and The Wall Street Journal, contributed significantly to technical analysis’ modern foundations in the late 19th and early 20th centuries. Dow’s theories that the market discounts everything and that price movements are not purely random but move in trends are central to technical analysis. These principles were later formalized into the Dow Theory.
1920s and 1930s – Chart Patterns and Indicators
In the early 20th century, pioneers like William P. Hamilton, Robert Rhea, Edson Gould, and John Magee further developed Do’s theories. This era saw the identification of classic chart patterns such as Head and Shoulders, Cup and Handle, Triple Tops and Bottoms, and many others.
During the same period, various technical indicators like moving averages started to gain popularity. These indicators were used to smooth out price data and generate signals based on trend-following or mean-reverting patterns.
1960s and 1970s – The Age of Computerization
The advent of computers in the 1960s revolutionized technical analysis. With greater computing power, traders could now compute complex mathematical formulas and indicators in real-time, leading to the development of a variety of new technical tools.
This era also saw the publication of influential books like Technical Analysis of Stock Trends by Edwards and Magee, and “A Random Walk Down Wall Street by Burton Malkiel, which popularized the field.
Late 20th Century – Modern Technical Analysis
The late 20th century witnessed an explosion of new technical analysis tools and indicators. Concepts like relative strength index (RSI), moving average convergence divergence (MACD), Bollinger Bands, and many others were developed during this time. The advent of the internet made these tools widely accessible to retail traders and investors.
21st Century – Advanced Charting Platforms and Machine Learning
Today, technical analysis is a crucial part of the trader’s toolkit. Advanced charting platforms, algorithmic trading, and even artificial intelligence and machine learning have made technical analysis more powerful and accessible than ever before.
The field of technical analysis has evolved significantly over the centuries. While it remains rooted in its core principles, it continues to adapt to the changing landscape of the financial markets. As we move forward, we can expect technical analysis to continue evolving, with newer tools and techniques likely to emerge.
Why Trade Using Technical Analysis?
Technical Analysis is one of the main methodologies used by traders to predict future price movements and make informed trading decisions. The primary reason to use technical analysis is its fundamental assumption that history tends to repeat itself, mainly due to market psychology. Traders often react in a predictable way to certain events and price patterns, forming identifiable market trends.
By studying past market data, especially price and volume, technical analysis helps traders understand how the market is likely to move. It provides insights into potential trading opportunities by identifying trends and key price levels of resistance and support. It can also help traders manage risk by offering indicators for setting stop-loss and take-profit points.
When to Trade Using Technical Analysis?
Technical Analysis can be applied to any market where historical trading data is available. This includes stock markets, forex, futures, commodities, and even cryptocurrency markets. It can be used in various time frames, from short-term intraday trading to long-term investment decisions.
The applicability of technical analysis is not confined to a specific time; rather, it is an ongoing process. It’s critical during times of significant market events like earnings announcements, economic data releases, or sudden geopolitical changes, which can cause substantial price fluctuations. Such scenarios present opportunities for traders to exploit potential price trends.
However, it’s important to note that technical analysis should not be used exclusively. It’s most effective when used in conjunction with other forms of analysis like fundamental or sentiment analysis, giving a holistic view of the market.
How to Trade Using Technical Analysis?
Trading using technical analysis involves a multi-step process:
- Charting: Start by setting up a price chart for the asset you’re interested in. The most common type of chart used in technical analysis is the candlestick chart, but others like bar charts or line charts can also be used.
- Identify Trends: Look for patterns in the price data that suggest a trend. This might be an uptrend (prices are going up), downtrend (prices are going down), or sideways trend (prices are moving within a specific range).
- Apply Technical Indicators: These are mathematical calculations based on the price, volume, or open interest of a security or contract used by traders who follow technical analysis. Examples of popular technical indicators include moving averages, relative strength index (RSI), moving average convergence divergence (MACD), and Bollinger Bands.
- Establish Entry and Exit Points: Once a potential trend is identified, the next step is to determine where to enter and exit the market. These points are typically set around support and resistance levels.
- Risk Management: No matter how solid a strategy may seem, all trades come with risks. Technical analysis can provide tools for managing these risks. A common approach is to set a stop-loss order, which automatically closes out a position if the price drops to a certain level.
- Review and Adjust: Regularly review your trades to learn from both your successes and failures. Adjust your strategy as needed, taking into account any changes in the market.
Technical Analysis is a vast and intricate field with numerous approaches and techniques. While it can be a potent tool, it’s not foolproof and should be used as part of a broader trading strategy, taking into account other significant factors influencing the market.
Certainly, like any other methodology, technical analysis comes with its own set of advantages and disadvantages. Understanding these can help traders apply technical analysis more effectively and judiciously.
Advantages of Technical Analysis
- Broad Applicability: Technical analysis can be applied to virtually any tradable instrument that has historical trading data (like price and volume). This includes stocks, indices, commodities, forex, and cryptocurrencies.
- Timely Entry and Exit Points: It can provide concrete points for market entry and exit, often allowing traders to identify precise price levels for setting stop-loss and take-profit orders.
- Flexibility Across Time Frames: It is effective over various time frames, whether it’s short-term intraday trading or long-term investments.
- Trend Identification: One of the significant advantages of technical analysis is its ability to identify trends. This allows traders to make informed decisions about when to buy or sell.
- Stand-Alone Utility: Unlike other approaches, technical analysis can, in principle, be used independently without requiring any additional information, as it’s based purely on historical trading data.
Disadvantages of Technical Analysis
- Historical Performance Is Not a Guarantee: The biggest caveat of technical analysis is the presumption that history will repeat itself, which isn’t always the case. Market conditions change due to numerous factors like economic changes, policy adjustments, and unprecedented events.
- Self-Fulfilling Prophecy: Many market participants use technical analysis. When many traders respond to the same technical signals, it can sometimes create a self-fulfilling prophecy rather than an inherent change in supply or demand.
- Subjectivity: Despite its scientific veneer, technical analysis can often be subjective. Different analysts may interpret the same chart differently, leading to different trading decisions.
- Neglect of Fundamental Factors: Technical analysis typically doesn’t consider fundamental factors such as a company’s financial health, industry health, or macroeconomic indicators. This could potentially lead to inaccurate predictions if such factors dramatically influence the market.
- Overwhelming Complexity: The sheer number of patterns, indicators, and strategies that fall under technical analysis can be overwhelming for beginners. It requires substantial time and effort to learn, understand, and effectively implement these tools.
Market Psychology and Behavioral Finance
Market psychology and behavioral finance represent an area of study that incorporates psychological assumptions to understand investor behavior. It aims to explain why investors make irrational decisions and how these decisions affect the financial markets.
Market psychology suggests that traders, driven by fear and greed, create repetitive market patterns. When a large number of traders react to the same information in a similar manner, it results in trends in the markets. Understanding these mentalities allows traders to make better decisions about when to enter or exit trades.
Behavioral finance, on the other hand, studies how cognitive psychological biases affect financial decisions and markets. It explores biases like overconfidence, anchoring, confirmation bias, mental accounting, herd behavior, and loss aversion. By understanding these biases, traders can make more conscious investment decisions and avoid common pitfalls.
Price Charts & Chart Patterns
Price charts and chart patterns form the backbone of technical analysis. Price charts plot the price movement of a financial asset over a specified timeframe and provide a graphical representation of price trends. The most common types of charts include line charts, bar charts, and candlestick charts.
- Line Charts are the simplest form of charts, representing closing prices over a set period.
- Bar Charts display the opening, high, low, and closing prices for each period. Each vertical bar represents one time period (like a day, week, or month).
- Candlestick Charts originated from Japan and are similar to bar charts but visually represent price movements and patterns more dramatically.
Chart patterns are graphical representations of price movements that form identifiable patterns. These patterns help traders predict future price movements. Common chart patterns include Head and Shoulders, Double Tops and Bottoms, Triangles, Flags, and Wedges. Each pattern carries a specific prediction about future price action based on the historical repetition of these patterns.
Understanding these charts and patterns helps traders identify trends, volatility, and price levels that may signal buy or sell opportunities.
Common Mistakes and Pitfalls in Technical Analysis
Technical analysis can provide valuable insights into market trends and potential future price movements. However, like any trading strategy, it’s not immune to errors and pitfalls. Here are some common mistakes traders often make when applying technical analysis:
- Overreliance on a Single Indicator: Technical indicators are mathematical calculations based on an asset’s price and volume. While they can be helpful, no single indicator can provide a complete picture of the market. Relying solely on one can lead to a biased and incomplete view. Instead, traders should use a combination of indicators to confirm a trend or signal before making a trading decision.
- Ignoring Market Trends: One of the central principles of technical analysis is that prices move in trends. Ignoring the overall market trend can result in poor trading decisions. For example, if a trader takes a long position based on a technical signal, but the overall market is in a downtrend, the trade is unlikely to be successful.
- Lack of Risk Management: Technical analysis, like any other form of trading, involves risk. Traders often make the mistake of not setting appropriate stop-loss and take-profit levels. Setting these levels helps manage risk by defining the amount of loss a trader is willing to accept.
- Over complication: There are hundreds of technical indicators and chart patterns, but that doesn’t mean a trader needs to use them all. Overcomplicating a trading strategy with too many indicators can lead to confusion and indecision. Traders should find a few indicators that work well for them and stick to those.
- Chasing Past Performance: It’s a common mistake to think that because a certain asset or market has performed well in the past, it will continue to do so in the future. While history does tend to repeat itself to some extent, it’s essential to remember that past performance is not a guarantee of future results.
- Ignoring the Fundamentals: While technical analysis focuses on price and volume, ignoring fundamental analysis entirely can be a mistake. Fundamental factors such as economic data, earnings, and geopolitical events can significantly impact an asset’s price. It’s important to incorporate these factors into any analysis.
To avoid these common pitfalls, it’s important for traders to have a well-defined trading plan, use multiple indicators to confirm signals, follow the overall market trend, manage risk effectively, and incorporate fundamental analysis into their overall strategy. Continuous learning and adapting to changing market conditions are also key to successful trading.
LEARN FOR FREE OUR TWO MOST PROFITABLE STRATEGIES AND BE A PROFITABLE OPTION TRADER
Download Below our Two Best Options Strategies
Cash Secured Put Strategy

Covered Call Strategy

Chart Trading Patterns:
Bullish and Bearish Trendline Trading Pattern
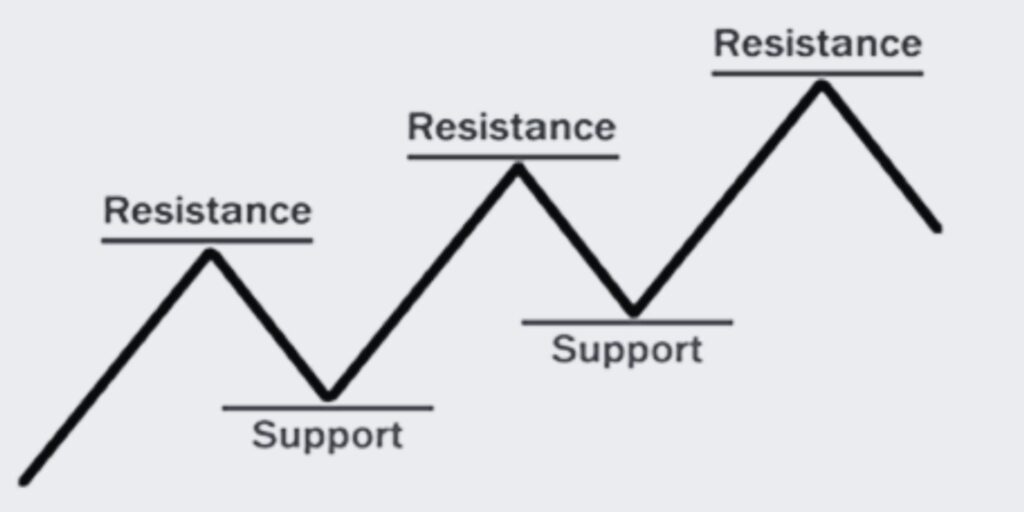
Let’s discover the Support and Resistance trading pattern, a fundamental concept in technical analysis for identifying key price levels and anticipating potential reversals in the market.
The Support and Resistance pattern is a fundamental concept in technical analysis that helps traders identify key levels where the price of an asset is likely to encounter obstacles. Support refers to a price level where buying interest is expected to outweigh selling pressure, causing the price to bounce back up.
Resistance, on the other hand, represents a price level where selling pressure is anticipated to outweigh buying interest, leading to a potential reversal or temporary halt in the price increase. By recognizing and analyzing these levels, traders can make informed decisions and enhance their trading strategies.
5 Tips for Using Support and Resistance Patterns
1. Identify Key Levels: Locate significant support and resistance levels based on historical price action. These levels can be determined by looking for previous swing highs and lows, trendlines, or horizontal levels where the price has repeatedly reversed.
2. Confirm with Multiple Indicators: Use multiple indicators or analysis techniques to confirm the significance of support and resistance levels. This may include trendlines, moving averages, Fibonacci retracements, or volume analysis.
3. Watch for Price Reactions: Observe how the price reacts when it approaches a support or resistance level. Look for signs of price rejection, such as long wicks or candlestick patterns, to anticipate potential reversals or bounces.
4. Consider Timeframe Analysis: Analyze support and resistance levels on multiple timeframes to get a broader perspective. Higher timeframe levels are often more significant and can have a stronger impact on price movements.
5. Adapt to Market Conditions: Support and resistance levels are not static and can change over time. Continuously reassess and adjust your levels based on new price developments and market dynamics.
FAQs
Q: What are support and resistance levels in trading?
A: Support and resistance levels are price levels where buying or selling pressure is expected to be significant. Support represents levels where buying interest is expected to outweigh selling pressure, while resistance represents levels where selling pressure is anticipated to outweigh buying interest.
Q: How do you trade support and resistance levels?
A: Traders can use support and resistance levels to identify potential entry and exit points. Buying opportunities can be sought near support levels, while selling opportunities can be considered near resistance levels. Traders may also watch for price reactions and use additional confirmation techniques to validate their trades.
Q: Are support and resistance levels always accurate?
A: Support and resistance levels are not foolproof and can sometimes be subject to false breakouts or breakdowns. It is important to use them in conjunction with other technical analysis tools and consider the overall market context.
Q: Can support become resistance and vice versa?
A: Yes, support levels can turn into resistance levels and vice versa. When the price breaks below a support level, it may later act as a resistance level upon retesting. Similarly, when the price breaks above a resistance level, it may later act as a support level.
Q: How do you determine the strength of support and resistance levels?
A: The strength of support and resistance levels can be determined by analyzing the number of times the price has respected those levels in the past. The more times the price has bounced off or reversed near a level, the stronger it is considered to be.
Summary: The Support and Resistance Trading Pattern is a powerful tool for identifying key price levels and anticipating potential reversals or bounces in the market. By understanding and effectively utilizing these levels, traders can improve their trading strategies and make more informed trading decisions.
Bullish and Bearish Trendline Trading Pattern
Let’s explore the Bullish and Bearish Trendline trading patterns, essential tools for identifying potential trend reversals and determining market direction.
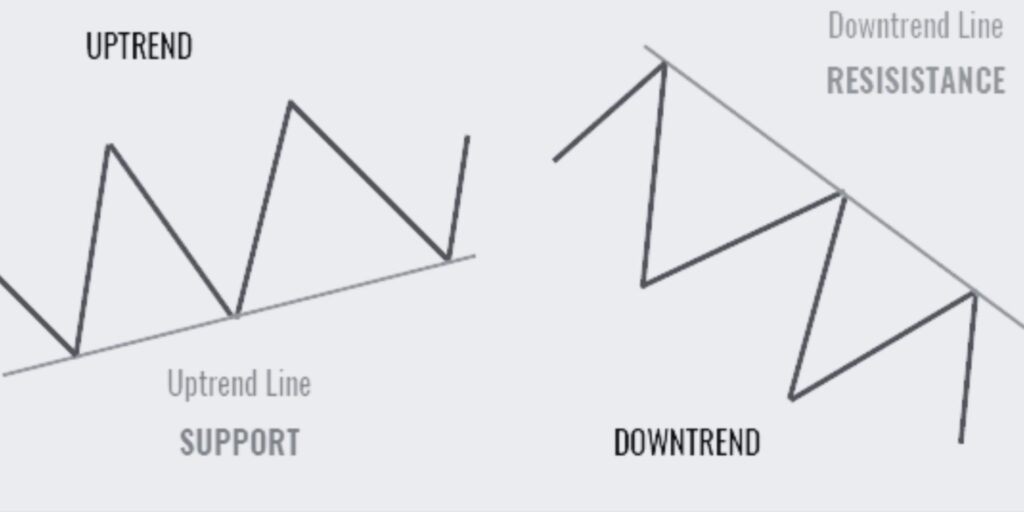
The Bullish and Bearish Trendline patterns are essential tools in technical analysis for identifying potential trend reversals and determining market direction. A Bullish Trendline is an upward sloping line connecting higher lows, indicating a strengthening uptrend.
Conversely, a Bearish Trendline is a downward sloping line connecting lower highs, signaling a deepening downtrend. By accurately drawing and interpreting these trendlines, traders can gain insights into market sentiment and make informed trading decisions.
5 Tips for Using Bullish and Bearish Trendline Patterns
1. Identify Trendline Slope: Observe the slope of the trendline. A bullish trendline has an upward slope, while a bearish trendline has a downward slope.
2. Confirm with Price Action: Look for price action that validates the trendline. In a bullish trendline, higher lows confirm the uptrend, while in a bearish trendline, lower highs confirm the downtrend.
3. Draw Trendlines Accurately: Draw the trendlines by connecting at least two significant swing points. The more touchpoints the trendline has, the stronger it is considered.
4. Use Multiple Timeframes: Confirm the trendline pattern by analyzing multiple timeframes. Consistency across different timeframes increases the reliability of the pattern.
5. Combine with Other Indicators: Use additional technical indicators, such as moving averages or oscillators, to confirm the trendline pattern and support trading decisions.
FAQs
Q: What are bullish and bearish trendline patterns in trading?
A: Bullish and bearish trendline patterns are visual representations of market trends. A bullish trendline connects higher lows and indicates an uptrend, while a bearish trendline connects lower highs and suggests a downtrend.
Q: How do you trade bullish and bearish trendline patterns?
A: Traders typically look for price bounces or breakouts at trendline levels to enter trades. In a bullish trendline, buying opportunities are sought at support levels, while in a bearish trendline, selling opportunities are considered at resistance levels.
Q: How reliable are bullish and bearish trendline patterns?
A: The reliability of trendline patterns depends on various factors, including the timeframe, market conditions, and the number of touchpoints on the trendline. It is crucial to combine trendlines with other technical analysis tools for confirmation.
Q: Can bullish and bearish trendline patterns fail?
A: Yes, trendline patterns can fail due to unexpected market movements or false breakouts. Traders should always consider risk management techniques and use trendlines in conjunction with other analysis tools.
Q: Can trendlines be drawn on any timeframe?
A: Yes, trendlines can be drawn on any timeframe, from short-term charts to long-term charts. The choice of timeframe depends on the trader’s trading style and the trend they want to analyze.
Summary: The Bullish and Bearish Trendline Trading Pattern is a powerful tool for identifying trend reversals and market direction. By mastering the art of drawing and interpreting trendlines, traders can gain valuable insights into market sentiment and enhance their trading decisions.
Bull and Bear Flag Trading Pattern
Let’s Explore the Bullish and Bearish Flag trading pattern, a reliable chart pattern in technical analysis. Learn how to identify and trade these patterns effectively, and understand their implications for future price movements.
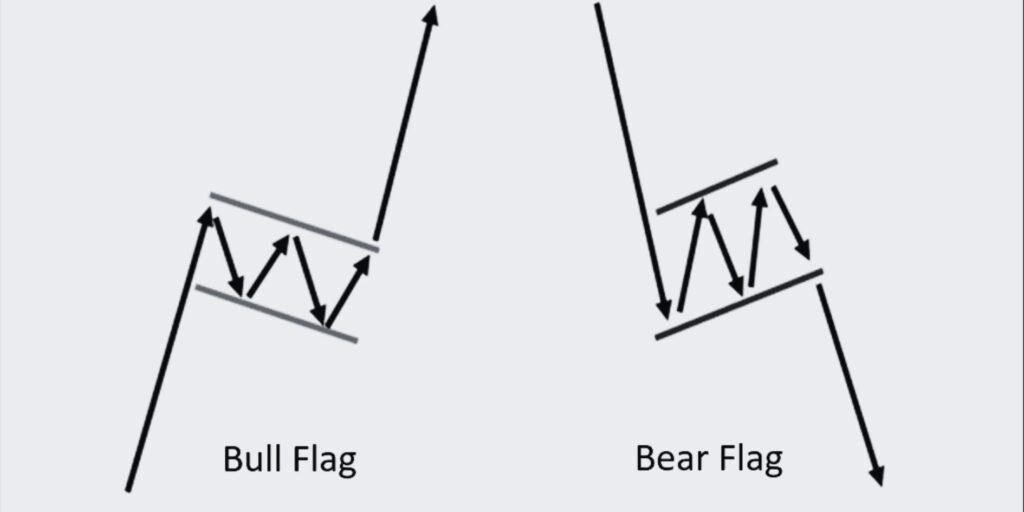
Flag patterns are among the most reliable and frequently occurring chart patterns in technical analysis. These continuation patterns suggest that a certain trend – bullish or bearish – is likely to continue after a brief consolidation.
Bullish Flag Pattern
A bullish flag pattern forms when the market consolidates after a strong upward move. It appears as a downward sloping channel (the flag) after a sharp price rally (the flagpole). The bullish flag is a signal that the market is taking a breather before the next leg upwards.
Bearish Flag Pattern
Conversely, a bearish flag pattern forms after a strong downward move, followed by a short-lived consolidation that slopes upward. This pattern suggests the market is likely to continue moving downwards after the consolidation period.
5 Tips for Using Flag Patterns
1. Wait for Confirmation: Always wait for a breakout in the direction of the prevailing trend before making a trade.
2. Volume Confirmation: The breakout should be accompanied by a rise in volume.
3. Use Stop-Loss Orders: Set stop-loss orders slightly outside the flag formation to protect against false breakouts.
4. Target Projection: Use the length of the flagpole to project the minimum price target.
5. Be Patient: It’s crucial to be patient and let the pattern fully develop before making a move.
FAQs
Q: What is a flag pattern in trading?
A: A flag pattern is a chart pattern used in technical analysis that indicates a continuation of the current trend after a brief period of consolidation.
Q: How do you trade flag patterns?
A: Trade flag patterns by waiting for price to break out of the flag formation in the direction of the prevailing trend. Confirmation with increased volume strengthens the signal.
Q: What is a bullish flag pattern?
A: A bullish flag pattern occurs after a strong price rally, followed by a period of consolidation. It’s a signal that the price is likely to continue its upward trend.
Q: What is a bearish flag pattern?
A: A bearish flag pattern occurs after a significant price decline, followed by a period of consolidation. This pattern suggests that the price is likely to continue its downward trend.
Q: How reliable are flag patterns?
A: Flag patterns are generally considered reliable, but like all chart patterns, they are not 100% accurate and should be used in conjunction with other technical analysis tools.
Summary: Understanding the bullish and bearish flag patterns can provide traders with valuable insights into market trends and potential future price movements. By incorporating these patterns into a comprehensive trading strategy, traders can take advantage of profitable trading opportunities. As always, remember to employ sound risk management strategies to protect your investment.
Bullish and Bearish Pennant Trading Pattern
Let’s uncover the Bullish and Bearish Pennant trading patterns, a classic chart pattern in technical analysis. Learn to identify and trade these patterns effectively, while understanding their impact on future price movements.
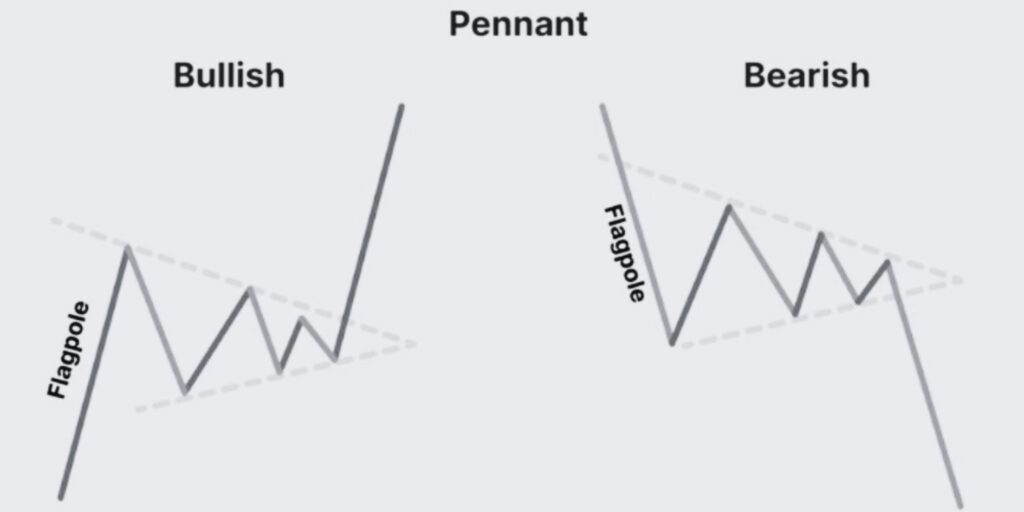
Pennant patterns are among the most reliable and frequently seen patterns in technical analysis. Similar to flags, pennants are continuation patterns that signal a pause in the existing trend before its resumption.
Bullish Pennant Pattern
A bullish pennant pattern is formed when the market consolidates after a sharp upward price move. The pennant, a small symmetrical triangle, forms after a swift rally (the flagpole). This pattern suggests that the market is consolidating before continuing the upward trend.
Bearish Pennant Pattern
On the other hand, a bearish pennant pattern forms after a robust downward price movement, followed by a consolidation period forming a small symmetrical triangle. The bearish pennant indicates that the market may resume its downward trend after the consolidation.
5 Tips for Using Pennant Patterns
1. Wait for Breakout: It’s crucial to wait for the price to break out of the pennant formation in the direction of the existing trend before trading.
2. Volume Confirmation: A breakout should be accompanied by an increase in volume for confirmation.
3. Set Stop-Loss Orders: Always place stop-loss orders slightly outside the pennant formation to protect against potential false breakouts.
4. Use Flagpole Length: The length of the flagpole can be used to estimate the minimum target price.
5. Patience is Key: The pattern needs time to develop fully; rushing may lead to poor trading decisions.
FAQs
Q: What is a pennant pattern in trading?
A: A pennant pattern is a chart pattern used in technical analysis that indicates a pause in the current trend, and is typically followed by a continuation of the trend.
Q: How do you trade pennant patterns?
A: To trade pennant patterns, wait for the price to break out of the pennant formation in the direction of the prevailing trend. This breakout should be confirmed by increased volume.
Q: What is a bullish pennant pattern?
A: A bullish pennant pattern occurs after a strong price rally, followed by a period of consolidation in a small symmetrical triangle. This pattern typically signals a continuation of the upward trend.
Q: What is a bearish pennant pattern?
A: A bearish pennant pattern forms after a significant price drop, followed by consolidation within a small symmetrical triangle. This pattern suggests a likely continuation of the downward trend.
Q: How reliable are pennant patterns?
A: Pennant patterns are generally considered reliable, but as with all chart patterns, they aren’t foolproof and should be used alongside other technical analysis tools.
Summary: Understanding the bullish and bearish pennant patterns can equip traders with essential insights into market trends and future price movements. Incorporating these patterns into a broader trading strategy can enable traders to leverage profitable trading opportunities. As always, employing effective risk management strategies is vital to safeguard your investments.
Ascending, Descending, and Horizontal Channel Trading Pattern
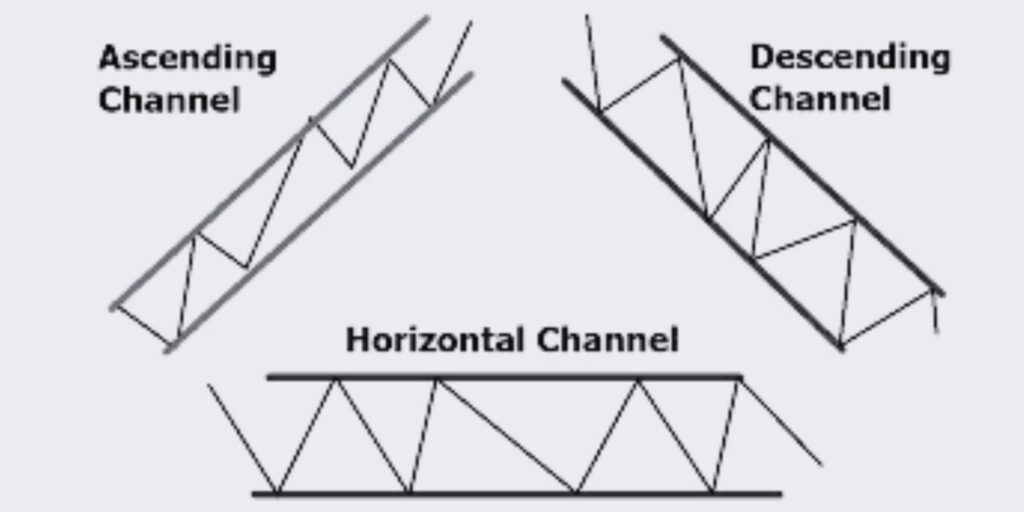
The Ascending, Descending, and Horizontal Channel patterns are commonly used in technical analysis to identify price channels and potential trading opportunities. These patterns consist of parallel trendlines that encompass the price action within a defined range.
The Ascending Channel indicates a bullish trend, the Descending Channel represents a bearish trend, and the Horizontal Channel suggests a period of consolidation. By recognizing these patterns and their characteristics, traders can anticipate potential breakouts or reversals and adjust their trading strategies accordingly.
5 Tips for Using Channel Trading Patterns
1. Identify Channel Boundaries: Draw the upper and lower trendlines to define the channel boundaries. Connect at least two significant swing highs and two swing lows to form parallel lines.
2. Confirm Channel Direction: Determine whether the channel is ascending, descending, or horizontal. Ascending channels have higher lows and higher highs, descending channels have lower highs and lower lows, while horizontal channels have relatively equal highs and lows.
3. Trade Breakouts: Look for breakouts from the channel boundaries. In an ascending channel, a bullish breakout occurs when the price moves above the upper trendline. In a descending channel, a bearish breakout happens when the price drops below the lower trendline.
4. Manage Risk: Set stop-loss orders to protect against false breakouts or reversals. Consider placing stop-loss orders beyond the opposite channel boundary to account for potential volatility.
5. Combine with Other Indicators: Use additional technical indicators, such as oscillators or moving averages, to confirm trading signals generated by channel patterns. Look for convergence or divergence between the price and the indicator to enhance the reliability of the signals.
FAQs
Q: What are ascending, descending, and horizontal channel patterns in trading?
A: Ascending, descending, and horizontal channel patterns are technical chart patterns that represent different market trends. An ascending channel consists of higher highs and higher lows, a descending channel has lower highs and lower lows, and a horizontal channel shows relatively equal highs and lows.
Q: How do you trade channel patterns?
A: Traders can trade channel patterns by entering positions near the channel boundaries and aiming for profits during breakouts. Buying opportunities are sought near the lower trendline in ascending channels, while selling opportunities are considered near the upper trendline in descending channels.
Q: What is the significance of channel breakouts?
A: Channel breakouts can indicate potential trend reversals or continuation. A breakout above the upper trendline in an ascending or horizontal channel suggests a bullish move, while a breakout below the lower trendline in a descending or horizontal channel signals a bearish move.
Q: Can channels be used in all market conditions?
A: Channels can be used in different market conditions, including trending and ranging markets. However, it is essential to adapt your trading strategy and consider other market factors for better decision-making.
Q: What are the potential limitations of channel patterns?
A: Channel patterns are not foolproof and can sometimes be subject to false breakouts or breakdowns. Traders should exercise caution, use proper risk management techniques, and consider other supporting indicators to increase the reliability of their trades.
Summary
The Ascending, Descending, and Horizontal Channel Trading Pattern is a valuable tool for identifying price channels and potential trading opportunities. By understanding the characteristics of these patterns and incorporating them into their analysis, traders can improve their trading strategies and enhance their overall trading performance.
Bullish and Bearish Channel Trading Pattern
Let’s get familiar with Bullish and Bearish Channel trading patterns and their roles in identifying potential trading opportunities. Learn how to spot these patterns and trade effectively within these channels
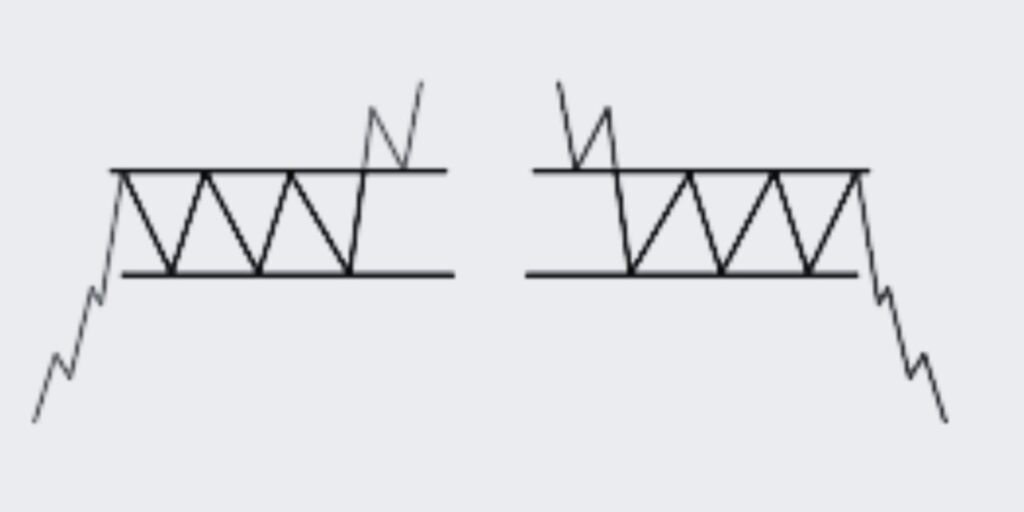
Channel patterns are critical tools for traders, providing a framework within which the price tends to move. They are formed by drawing two parallel trend lines around the price action. Bullish and bearish channels are two primary types of channel patterns.
Bullish Channel Pattern
A bullish channel is characterized by an upward trend with the price making higher highs and higher lows. Traders look to buy at the lower trend line (support) and sell at the upper trend line (resistance). The pattern is confirmed when the price bounces between these lines.
Bearish Channel Pattern
A bearish channel, on the other hand, is characterized by a downward trend with the price making lower highs and lower lows. Traders look to sell at the upper trend line (resistance) and buy back at the lower trend line (support). Again, the pattern is confirmed when the price oscillates between these lines.
5 Tips for Using Channel Patterns
1. Wait for Confirmation: The channel is confirmed when the price touches each trend line at least twice.
2. Watch for Breakouts: A breakout of the channel can signal a strong move in the breakout direction.
3. Use Volume as Confirmation: Breakouts with higher volume are usually more reliable.
4. Set Price Targets: The height of the channel can be used to set price targets.
5. Be Aware of False Breakouts: Not all breakouts result in a sustained move. Use stop-losses to protect against potential losses.
FAQs
Q: What is a channel pattern in trading?
A: A channel pattern is a chart pattern used in technical analysis to outline a trend and the range in which a security is trading. It is formed by drawing two parallel trend lines around the price action.
Q: How do you trade channel patterns?
A: Channel patterns are traded by buying near the lower trend line (support) and selling near the upper trend line (resistance). A breakout of the channel may signal a strong move in the breakout direction.
Q: What is a bullish channel pattern?
A: A bullish channel pattern is characterized by an upward trend with the price making higher highs and higher lows. Traders look to buy at the lower trend line (support) and sell at the upper trend line (resistance).
Q: What is a bearish channel pattern?
A: A bearish channel pattern is characterized by a downward trend with the price making lower highs and lower lows. Traders look to sell at the upper trend line (resistance) and buy back at the lower trend line (support).
Q: How reliable are channel patterns?
A: Channel patterns are widely recognized and used by traders. They can be quite reliable, especially when combined with other indicators and patterns. However, they are not foolproof and should be used in conjunction with other technical analysis tools.
Summary: Channel patterns, particularly bullish and bearish channels, offer valuable insights for traders. When correctly identified and interpreted, they provide key levels of support and resistance, helping to identify potential buying and selling opportunities. However, as with any trading strategy, it’s essential to manage risk effectively through measures like setting stop-loss orders and diversifying your portfolio.
Cup and Handle Trading Pattern
Let’s explore the Cup and Handle trading pattern, a bullish continuation pattern that signals a potential breakout. Learn how to identify and effectively trade this pattern
The Cup and Handle is a bullish continuation pattern that marks a consolidation period followed by a breakout. As its name implies, the pattern is made up of two parts: the “cup” and the “handle”.
The Cup:
A round bottom that looks like a bowl or a rounding bottom. The cup is typically a long-term movement, which can last for a few weeks to a year, but should not be too deep. The more rounded and smoother the bottom, the stronger the signal.
The Handle:
A small pullback that follows the cup. The handle represents the final consolidation before the big breakout and should be noticeably smaller than the cup (usually one-third the size of the cup).
5 Tips for Using the Cup and Handle Pattern
1. Look for a Prior Uptrend: For a valid cup and handle pattern, there should be a prior uptrend.
2. Consider the Depth of the Cup: The cup should not be overly deep. Ideally, it should not retrace more than 50% of the prior up-move.
3. Look for a Handle that’s Downward Sloping: A handle that slopes downwards is generally considered more bullish.
4. Use Volume as Confirmation: The right side of the cup and the breakout above the handle’s resistance should occur with increased volume.
5. Set Price Targets: The price target is derived by adding the depth of the cup to the breakout point.
FAQs
Q: What is a cup and handle pattern in trading?
A: The cup and handle pattern is a bullish continuation pattern. It’s characterized by a “cup” (round bottom) and a “handle” (short pullback), followed by a breakout to the upside.
Q: How do you trade cup and handle patterns?
A: The entry point is a long trade placed when the price breaks out above the resistance line drawn from the top of the cup. A stop loss can be set just below the handle. The price target is derived by adding the depth of the cup to the breakout point.
Q: How long does the cup and handle pattern take to form?
A: The cup typically forms over a period of 1 to 6 months, while the handle usually forms over a few days to a few weeks.
Q: How reliable are cup and handle patterns?
A: The cup and handle pattern is widely recognized and used by traders, and it can be quite reliable. However, it is not foolproof and should be used in conjunction with other technical analysis tools.
Q: Can a cup and handle pattern fail?
A: Yes, like all chart patterns, the cup and handle can fail. If the price falls back into the pattern after a breakout, or the handle part of the pattern becomes too long and deep, the pattern may be considered failed.
Summary: The Cup and Handle pattern is a valuable tool for traders, providing a visual representation of a period of consolidation followed by a potential breakout. Recognizing this pattern and understanding its characteristics can help traders make informed decisions, taking into account both the opportunities and risks it presents.
Symmetrical Triangle Trading Pattern
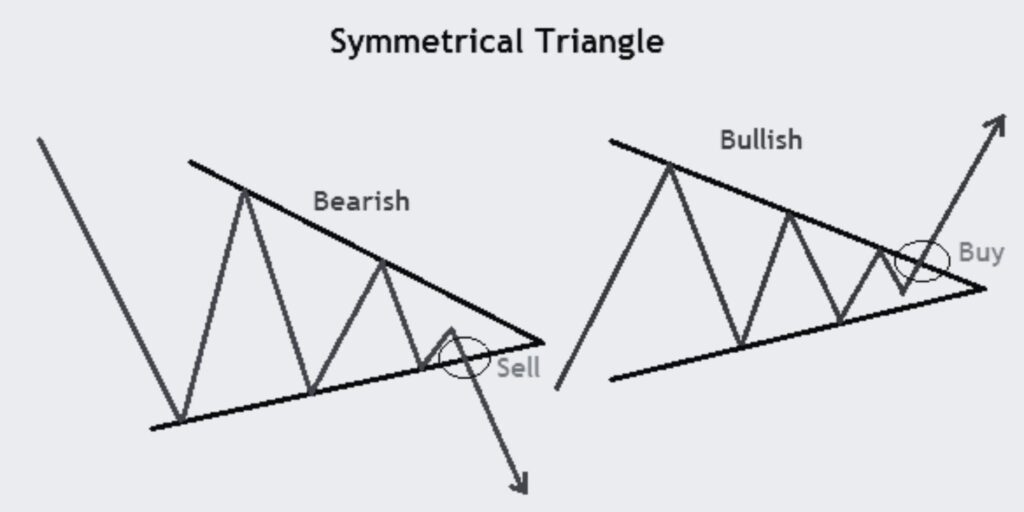
Let’s uncover the Symmetrical Triangle trading pattern, a significant tool for identifying periods of market consolidation and predicting potential breakouts.
The Symmetrical Triangle is a common continuation pattern that signals a period of consolidation in a trend followed by the resumption of the original trend. The pattern is formed by two converging trend lines, drawn as the price makes lower highs and higher lows. This action forms a triangle, which is completed upon a breakout.
5 Tips for Using the Symmetrical Triangle Pattern
1. Look for Converging Trend Lines: The Symmetrical Triangle is defined by a falling resistance line and a rising support line. Ensure they are converging to validate the pattern.
2. Volume is Key: Typically, volume declines as the price oscillates between the trend lines. A breakout should then occur on increased volume, providing a strong signal.
3. Wait for the Breakout: It’s crucial to wait for the price to break through one of the trend lines before trading, as the direction of the breakout will indicate whether it’s a bullish or bearish signal.
4. Be Aware of False Breakouts: Be cautious of false breakouts where the price breaks the trend line but quickly reverses direction.
5. Use Price Targets: The target can be estimated by measuring the widest distance of the triangle and extending it from the breakout point.
FAQs
Q: What is a symmetrical triangle pattern in trading?
A: The symmetrical triangle is a continuation pattern that signals a period of consolidation before the price continues in the direction of the original trend. It’s identified by two converging trend lines.
Q: How do you trade symmetrical triangle patterns?
A: Traders should wait for a breakout from the triangle before placing a trade. A break above the resistance line signals a continuation of the uptrend, while a break below the support line signals a continuation of the downtrend.
Q: How long does the symmetrical triangle pattern take to form?
A: A symmetrical triangle can form over a period of a few weeks to several months. However, the timing can vary depending on the price action and the specific asset being traded.
Q: How reliable are symmetrical triangle patterns?
A: Symmetrical triangles are generally considered reliable patterns. However, like all trading patterns, they should be used in conjunction with other technical analysis tools and indicators for the best results.
Q: Can a symmetrical triangle pattern fail?
A: Yes, like all chart patterns, the symmetrical triangle can fail. This typically happens when a breakout occurs but the price quickly reverses direction and moves back into the triangle.
Summary: The Symmetrical Triangle trading pattern is a valuable tool for traders to identify periods of market consolidation and potential breakouts. With effective use, it can help traders to make informed decisions based on the anticipated price action.
YOU MAY ALSO BE INTERESTED IN READING AND LEARNING ABOUT OUR 5 CONCEPTS OF ANALYZING A BUSINESS TO TRADE STOCK AND STOCK OPTIONS

Rectangle Trading Pattern

Let’s discover the Rectangle trading pattern, a pivotal tool in understanding market consolidation and predicting potential breakouts.
The Rectangle Trading Pattern is a common continuation pattern that signals a period of consolidation within a trend. The pattern is identified by a price range that the price action has been oscillating between for an extended period. This rectangle is completed upon a breakout, signifying the continuation of the prior trend.
5 Tips for Using the Rectangle Pattern
1. Identify the Rectangle: The pattern consists of at least two similar highs and two similar lows. The highs form the resistance of the rectangle and the lows form the support.
2. Volume Patterns: The volume usually decreases as the pattern progresses and increases on the breakout.
3. Wait for Confirmation: It’s important to wait for confirmation of the breakout, which could be a closing price outside the range of the rectangle.
4. Avoid False Breakouts: False breakouts can occur, where the price moves outside the rectangle but then reverses back into the range.
5. Set Targets: The expected move of the breakout is typically the height of the rectangle added or subtracted from the breakout point.
FAQs
Q: What is a rectangle pattern in trading?
A: A rectangle pattern is a price pattern that occurs when supply and demand reach equilibrium and the price action moves sideways for a period of time before continuing in the direction of the prevailing trend.
Q: How do you trade rectangle patterns?
A: Traders should wait for the price to break out of the rectangle range before entering a trade. The direction of the breakout can be used to determine whether to enter a long or short position.
Q: How long does the rectangle pattern take to form?
A: The rectangle pattern can form over varying time periods, but typically forms over a period of a few weeks to several months.
Q: How reliable are rectangle patterns?
A: Rectangle patterns are generally reliable for identifying periods of consolidation and predicting potential breakouts. However, they should be used in conjunction with other indicators for the best results.
Q: Can a rectangle pattern fail?
A: Yes, like all chart patterns, the rectangle pattern can fail, usually signaled by a false breakout where the price moves back into the rectangle range.
Summary: The Rectangle Trading Pattern is a handy tool in a trader’s arsenal, providing valuable insights into periods of market consolidation and potential breakouts. With the right approach, it can help traders make informed decisions based on anticipated price action.
Double Top and Bottom Trading Patterns
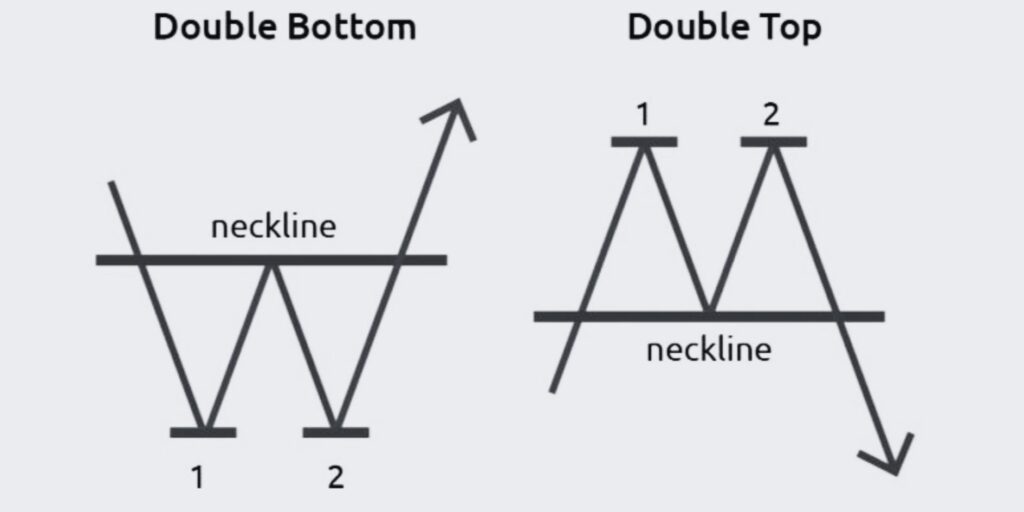
Let’s explore the Double Top and Bottom trading patterns, reliable indicators for trend reversals in the market.
Double Top and Bottom patterns are commonly used in technical analysis as indicators of trend reversals. These patterns occur when the price reaches a certain level twice but can’t surpass it, often indicating that a reversal is about to occur. The Double Top signals a reversal from an uptrend to a downtrend, while the Double Bottom indicates a reversal from a downtrend to an uptrend.
5 Tips for Using Double Top and Bottom Patterns
1. Identify the Pattern: Look for a significant rise in price (for a double top) or drop in price (for a double bottom), followed by a retracement, and then another move to the same level.
2. Volume Patterns: Typically, the volume will decrease during the formation of the second top/bottom and will then increase with the price break.
3. Wait for Confirmation: Wait for the price to break below the lowest point between the two tops (for a double top) or above the highest point between the two bottoms (for a double bottom).
4. Avoid False Breakouts: A false breakout can occur, which can trap traders who act too quickly.
5. Set Targets: The target price following the breakout is usually the same vertical distance as between the two tops/bottoms and the breakout point.
FAQs
Q: What are double top and bottom patterns in trading?
A: Double top and bottom patterns are chart patterns that signify a trend reversal. A double top forms after an uptrend and signals a shift to a downtrend, while a double bottom forms after a downtrend and signals a shift to an uptrend.
Q: How do you trade double top and bottom patterns?
A: These patterns are traded by waiting for confirmation of the trend reversal (the price break), and then going short for a double top or going long for a double bottom.
Q: How long does it take for double top and bottom patterns to form?
A: These patterns can form over a period of a few weeks to several months, but the exact timing can vary widely depending on the price action and the specific asset being traded.
Q: How reliable are double top and bottom patterns?
A: While they are generally considered reliable indicators of trend reversals, they should be used in conjunction with other indicators and analysis techniques for the best results.
Q: Can double top and bottom patterns fail?
A: Yes, these patterns can fail. For example, a false breakout can occur, which can lead to losses if traders act too quickly.
Summary: The Double Top and Bottom Trading Patterns are powerful indicators of trend reversals. By accurately identifying these patterns and applying proper trading techniques, traders can potentially make profitable trades in line with the new trend.
Head and Shoulders Trading Pattern

Let’s uncover the Head and Shoulders trading pattern, a vital tool in predicting trend reversals in the market.
The Head and Shoulders pattern is one of the most popular and reliable chart patterns in technical analysis. This pattern is used to predict trend reversals, showing that the security is likely to move against the previous trend. It is called the Head and Shoulders pattern due to its resemblance to a head with two shoulders.
5 Tips for Using Head and Shoulders Pattern
1. Identify the Pattern: The head and shoulders pattern consists of a peak (shoulder), followed by a higher peak (head), and then another lower peak (shoulder).
2. Volume Observation: Typically, the volume follows a specific pattern: highest on the left shoulder, less on the head, and least on the right shoulder.
3. Wait for Confirmation: The pattern is confirmed once the price breaks below the neckline (the level of support).
4. Avoid False Breakouts: Be patient and avoid trading on false breakouts.
5. Set Targets: Measure the distance from the neckline to the top of the head and subtract that from the breakout point at the neckline to get a price target.
FAQs
Q: What is the head and shoulders pattern in trading?
A: The head and shoulders pattern is a chart formation that predicts a bullish-to-bearish trend reversal. It’s one of the most reliable trend reversal patterns.
Q: How do you trade the head and shoulders pattern?
A: Traders usually wait for the price to break below the neckline after the formation of the second shoulder and then place a short position.
Q: How long does it take for the head and shoulders pattern to form?
A: This pattern can form over a period ranging from several weeks to many months.
Q: How reliable is the head and shoulders pattern?
A: While it is generally considered to be one of the most reliable trend reversal patterns, it should be used along with other forms of analysis to confirm signals.
Q: Can the head and shoulders pattern fail?
A: Yes, this pattern can fail. False breakouts can occur, leading to potential losses if traders act too quickly.
Summary
The Head and Shoulders Trading Pattern is a crucial tool in technical analysis, helping to identify trend reversals with a high degree of accuracy. With careful analysis and application of proper trading techniques, traders can leverage this pattern to make successful trades.
Inverse Head and Shoulders Trading Pattern
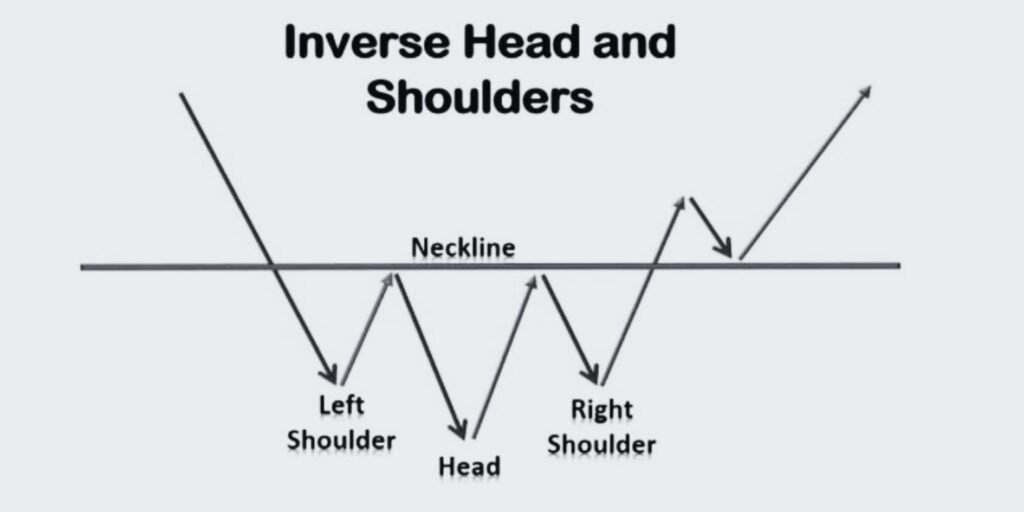
Let’s dive in to the Inverse Head and Shoulders trading pattern, a reliable indicator of potential bullish trend reversals in the market
The Inverse Head and Shoulders pattern is a reliable bullish chart pattern used in technical analysis to predict trend reversals. It is the opposite of the Head and Shoulders pattern and indicates a potential shift from a downtrend to an uptrend. The pattern resembles a head with two shoulders, but in reverse.
5 Tips for Using Inverse Head and Shoulders Pattern
1. Identify the Pattern: The inverse head and shoulders pattern consists of a valley (shoulder), followed by a lower valley (head), and then another higher valley (shoulder).
2. Volume Observation: Typically, the volume exhibits a pattern where it is highest during the formation of the head and lower during the creation of the shoulders.
3. Wait for Confirmation: The pattern is confirmed once the price breaks above the neckline (the level of resistance).
4. Avoid False Breakouts: Be patient and avoid trading on false breakouts to minimize potential losses.
5. Set Targets: Measure the distance from the neckline to the bottom of the head and add that to the breakout point to determine a potential price target.
FAQs
Q: What is the inverse head and shoulders pattern in trading?
A: The inverse head and shoulders pattern is a bullish chart formation that signals a potential trend reversal from a downtrend to an uptrend. It is the opposite of the head and shoulders pattern.
Q: How do you trade the inverse head and shoulders pattern?
A: Traders typically wait for the price to break above the neckline after the formation of the second shoulder and then consider entering a long position.
Q: How long does it take for the inverse head and shoulders pattern to form?
A: The timeframe for the formation of the inverse head and shoulders pattern can vary, but it usually occurs over several weeks to months.
Q: How reliable is the inverse head and shoulders pattern?
A: The inverse head and shoulders pattern is considered to be a reliable indicator of trend reversals, but it is always recommended to use it in conjunction with other technical analysis tools and indicators for confirmation.
Q: Can the inverse head and shoulders pattern fail?
A: While the inverse head and shoulders pattern is generally reliable, there is still a possibility of false breakouts or other factors that could lead to its failure. It’s essential to exercise caution and consider other aspects of analysis.
Summary: The Inverse Head and Shoulders Trading Pattern is a valuable tool in technical analysis, providing insights into potential bullish trend reversals. By identifying and utilizing this pattern effectively, traders can make informed trading decisions and potentially capture profitable opportunities.
Falling and Rising Wedge Trading Patterns
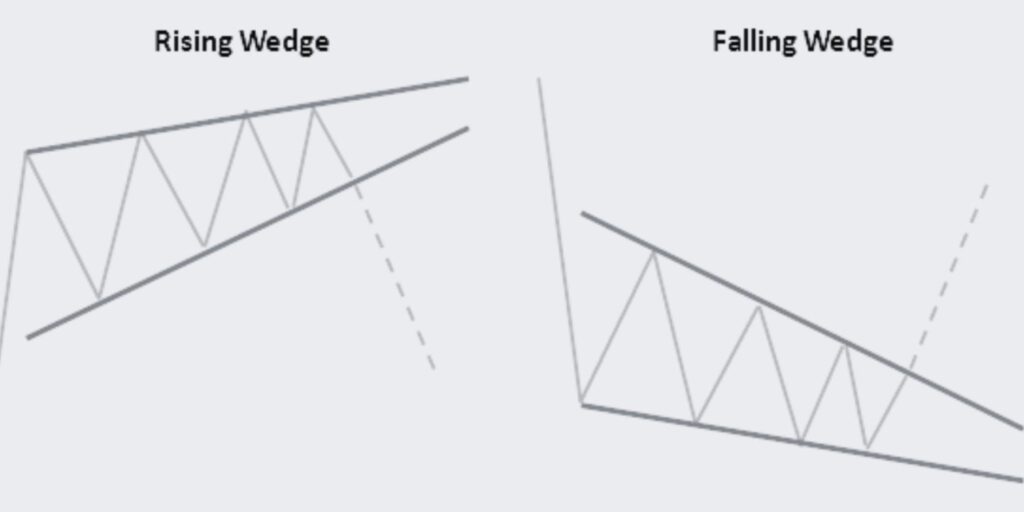
Let’s explore the Falling and Rising Wedge trading patterns, valuable indicators of potential trend reversals in the market.
The Falling and Rising Wedge patterns are common chart patterns used in technical analysis to identify potential trend reversals. A Falling Wedge is a bullish pattern that usually forms during a downtrend, while a Rising Wedge is a bearish pattern that typically occurs during an uptrend. These patterns are characterized by converging trendlines that slope in different directions.
5 Tips for Using Falling and Rising Wedge Patterns
1. Identify the Pattern: Falling Wedges feature a contracting range with lower lows and lower highs, while Rising Wedges have a narrowing range with higher highs and higher lows.
2. Volume Observation: Volume tends to decrease as the pattern develops and increase upon breakout.
3. Wait for Confirmation: Wait for the price to break above the upper trendline in a Falling Wedge or below the lower trendline in a Rising Wedge to confirm the pattern.
4. Avoid False Breakouts: False breakouts can occur, so it’s important to wait for a clear breakout and confirmation.
5. Set Targets: Measure the height of the wedge and project it upward for Falling Wedges or downward for Rising Wedges to estimate potential price targets.
FAQs
Q: What are falling and rising wedge patterns in trading?
A: Falling and rising wedges are chart patterns that signify potential trend reversals. Falling wedges are bullish patterns, while rising wedges are bearish patterns.
Q: How do you trade falling and rising wedge patterns?
A: Traders typically wait for a breakout from the wedge pattern and enter a trade in the direction of the breakout. A bullish trade is initiated on a breakout from a falling wedge, and a bearish trade is initiated on a breakout from a rising wedge.
Q: How long does it take for falling and rising wedge patterns to form?
A: The timeframe for the formation of falling and rising wedge patterns can vary, but they typically develop over several weeks to a few months.
Q: How reliable are falling and rising wedge patterns?
A: Falling and rising wedges are generally considered reliable patterns, but it’s essential to use them in conjunction with other technical analysis tools and indicators for confirmation.
Q: Can falling and rising wedge patterns fail?
A: Yes, like any chart pattern, falling and rising wedges can fail. False breakouts or unexpected price movements may occur, leading to potential losses.
Summary: The Falling and Rising Wedge Trading Patterns are valuable tools for identifying potential trend reversals. By understanding these patterns and using proper trading techniques, traders can gain insights into market dynamics and potentially capitalize on profitable trading opportunities.
Triple Top and Bottom Falling and Rising Wedge Trading Patterns
Let’s discover the Triple Top and Bottom Falling and Rising Wedge trading patterns, powerful indicators of potential trend reversals in the market.
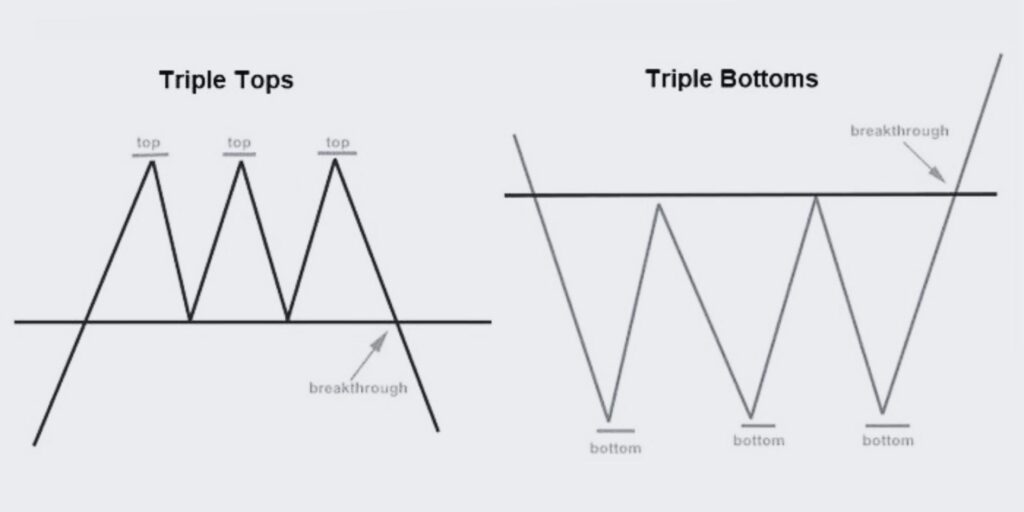
The Triple Top and Bottom patterns combined with the Falling and Rising Wedge patterns are powerful technical analysis tools used to identify potential trend reversals. A Triple Top is a bearish pattern that signifies the end of an uptrend, while a Triple Bottom is a bullish pattern indicating the end of a downtrend. When these patterns coincide with Falling or Rising Wedges, they provide additional confirmation and enhance the predictive strength of the signals.
5 Tips for Using Triple Top and Bottom Falling and Rising Wedge Patterns
1. Identify the Patterns: Look for three consecutive peaks (Triple Top) or three consecutive troughs (Triple Bottom) that form significant levels of resistance or support. When combined with Falling or Rising Wedges, the convergence of multiple signals strengthens the pattern.
2. Volume Observation: Observe the volume patterns during the formation of the patterns. Typically, the volume decreases as the Triple Top or Bottom develops and increases during the breakout.
3. Wait for Confirmation: Wait for a breakout below the support level for a Triple Top with Falling Wedge, or above the resistance level for a Triple Bottom with Rising Wedge, to confirm the pattern.
4. Avoid False Breakouts: False breakouts can occur, so it’s important to wait for a clear breakout and confirmation before entering a trade.
5. Set Targets: Measure the vertical distance between the highest point of the pattern and the support level for a Triple Top, or the lowest point of the pattern and the resistance level for a Triple Bottom. Project this distance from the breakout point to estimate potential price targets.
FAQs
Q: What are triple top and bottom patterns in trading?
A: Triple top and bottom patterns are chart patterns that indicate potential trend reversals. A triple top forms after an uptrend and signals a shift to a downtrend, while a triple bottom forms after a downtrend and signals a shift to an uptrend.
Q: How do you trade triple top and bottom patterns with falling and rising wedges?
A: Traders typically wait for a breakout from the pattern, combined with the falling or rising wedge, to confirm the trend reversal. A bearish trade is initiated on a breakout from a triple top with a falling wedge, while a bullish trade is initiated on a breakout from a triple bottom with a rising wedge.
Q: How long does it take for triple top and bottom patterns to form?
A: The timeframe for the formation of triple top and bottom patterns can vary, but they generally develop over several weeks to a few months.
Q: How reliable are triple top and bottom patterns with falling and rising wedges?
A: When combined with falling and rising wedges, triple top and bottom patterns provide enhanced reliability. However, it’s essential to use them alongside other technical analysis tools and indicators for confirmation.
Q: Can triple top and bottom patterns with falling and rising wedges fail?
A: Like any chart patterns, triple top and bottom patterns with falling and rising wedges can fail. Traders should be cautious of false breakouts or unexpected market movements that may lead to potential losses.
Summary: The Triple Top and Bottom Falling and Rising Wedge Trading Patterns are powerful indicators of potential trend reversals. By combining multiple patterns and understanding their dynamics, traders can make more informed trading decisions and potentially capture profitable opportunities in the market.
Rounding Bottom Trading Pattern
Let’s explore the Rounding Bottom trading pattern, a reliable indicator of potential trend reversals in the market
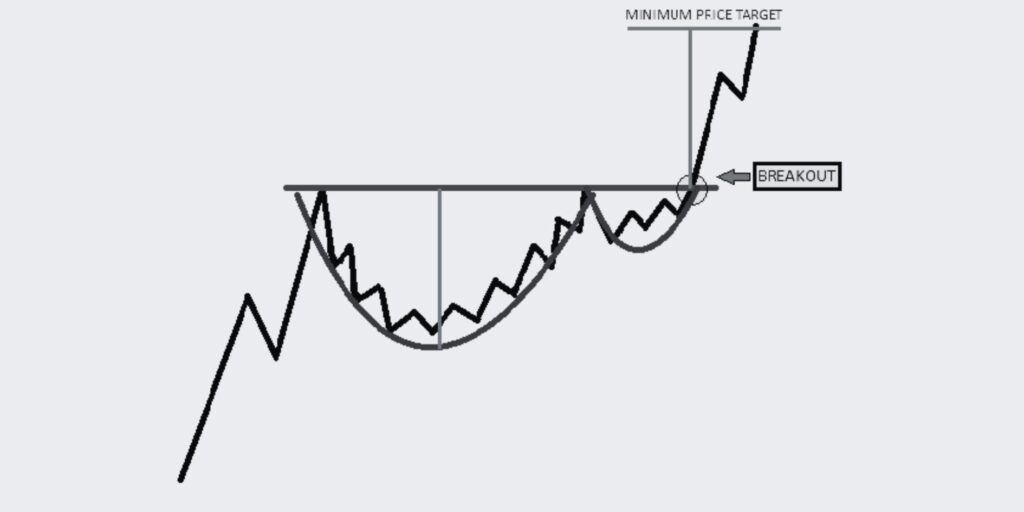
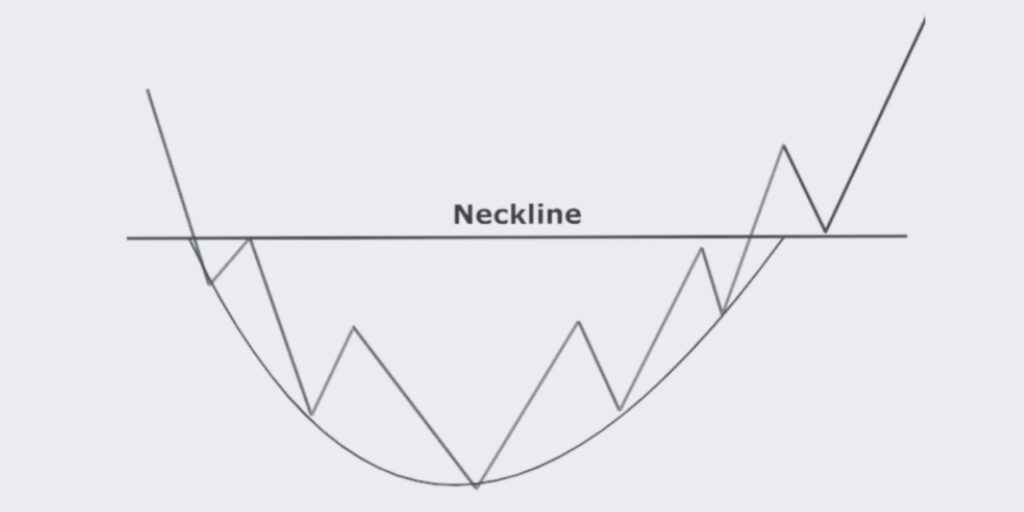
The Rounding Bottom pattern, also known as the saucer bottom, is a bullish chart pattern used in technical analysis to identify potential trend reversals. This pattern is characterized by a gradual and rounded shape formed by the price action, indicating a transition from a downtrend to an uptrend. The Rounding Bottom pattern suggests a long-term accumulation of the asset, and once the pattern is confirmed, it may signal a strong bullish move.
5 Tips for Using Rounding Bottom Pattern
1. Identify the Pattern: The Rounding Bottom pattern is recognized by a gentle and smooth curve formed by the price, resembling a saucer or a rounded bottom.
2. Volume Observation: Volume tends to be highest at the beginning of the pattern, gradually decreasing as the pattern develops, and then increasing again when the price breaks out.
3. Wait for Confirmation: Confirm the pattern by waiting for the price to break above the resistance level, validating the trend reversal.
4. Consider Volume Confirmation: Look for an increase in volume when the breakout occurs to provide additional confirmation of the pattern.
5. Set Targets: Measure the depth of the pattern, from the lowest point to the resistance level, and project it upward from the breakout point to estimate potential price targets.
FAQs
Q: What is the rounding bottom pattern in trading?
A: The rounding bottom pattern is a bullish chart formation characterized by a gradual and rounded shape of the price action. It suggests a transition from a downtrend to an uptrend.
Q: How do you trade the rounding bottom pattern?
A: Traders typically wait for the price to break above the resistance level, confirming the rounding bottom pattern, and enter a long position to take advantage of the potential bullish move.
Q: How long does it take for the rounding bottom pattern to form?
A: The timeframe for the formation of the rounding bottom pattern can vary, ranging from a few weeks to several months, depending on the price action and the asset being analyzed.
Q: How reliable is the rounding bottom pattern?
A: The rounding bottom pattern is considered to be a reliable indicator of potential trend reversals, but it is always recommended to use it in conjunction with other technical analysis tools and indicators for confirmation.
Q: Can the rounding bottom pattern fail?
A: While the rounding bottom pattern is generally reliable, there is still a possibility of false breakouts or other factors that could lead to its failure. Traders should exercise caution and consider other aspects of analysis.
Summary: The Rounding Bottom Trading Pattern is a valuable tool in technical analysis for identifying potential trend reversals. By understanding the pattern and its characteristics, traders can enhance their decision-making process and potentially capture profitable trading opportunities.
Conclusion
trading chart patterns are essential tools that empower traders to understand market trends and make informed trading decisions. The article has delved into the fundamental concepts and examples of various chart patterns, including head and shoulders, double tops and bottoms, triangles, flags, and pennants, among others.
It’s evident that these patterns provide crucial insight into possible future price movements, offering traders the potential for profitable opportunities.
However, while these patterns can be incredibly valuable, it’s important to remember that no trading strategy is foolproof. Market conditions are influenced by a multitude of factors, and patterns should be used in conjunction with other forms of technical analysis and risk management strategies to ensure balanced and robust trading decisions.
To get the most out of trading chart patterns, it is necessary to develop a keen eye for identifying these patterns as they form and a disciplined approach to act on these insights. The key takeaway from this article is that learning to identify and understand trading chart patterns is an indispensable skill for anyone involved in trading or investing.
But it’s equally important to remember that chart patterns are just one of the tools in a trader’s arsenal and should be used as part of a diversified, carefully planned trading strategy